
Why Time Series Forecasting Matters in 2026
From the course Time Series Forecasting with Machine Learning
In every lesson
The AI Professor starts from the lesson you have open
You ask it in writing or by voice, right from the lesson, and you can listen to the answer on request. Where needed, it fills in from general knowledge. When you select a passage, a bar appears with “Explain this to me”, “Give me an example”, “Why does it matter?” and “My own question”.
Its panel has four tabs:
- Conversation: you ask, it answers starting from the lesson
- Summary: the key ideas of the lesson, point by point
- AI Quiz: 3, 5 or 10 new questions from the lesson, with explanations
- Review: flashcards made from the lesson
Included in every subscription and in single-course access, within a fair-use limit.
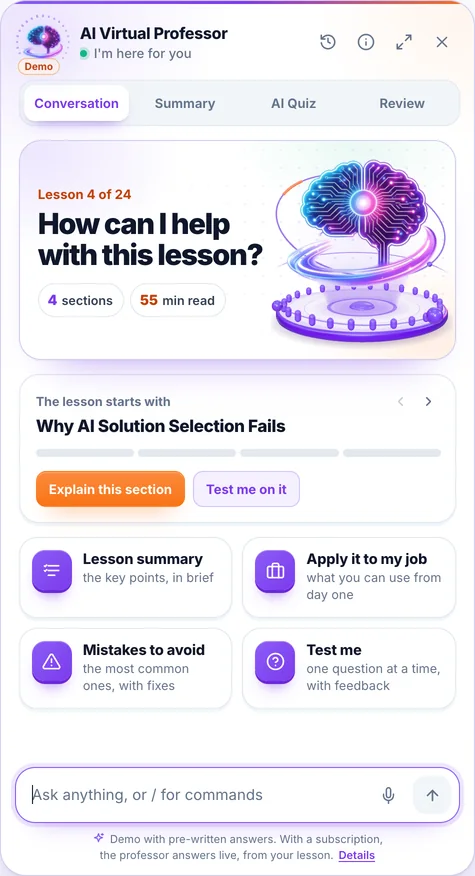
The demo opens on a lesson from the course “AI for Business Leaders”, with prepared answers; voice is off in the demo.
It is an artificial intelligence system, not a human teacher; its answers may contain errors. Details in the Terms & Conditions.
Almost every organization runs on questions about the future. How many units will we sell next month? How much electricity will the grid draw at 7 p.m. tomorrow? How many support tickets should we staff for? How many servers must be warm before the traffic spike? These are all time series forecasting problems, and in 2026 the tools to answer them span everything from a one-line seasonal-naive benchmark to pretrained foundation models that forecast unseen series with no training at all. This course teaches you to move confidently across that whole range and, just as importantly, to know which tool a given problem actually deserves.
Educational note: This course is for learning. Any data you use must respect data-protection law such as the GDPR when it contains personal data, dataset licenses, and confidentiality obligations. Where we touch financial series, treat every forecast as analysis and never as investment advice — no model in this course, or anywhere else, guarantees returns. Forecasts are probabilistic statements about the future, not certainties, and communicating that uncertainty honestly is part of the job.
What makes time series different
A time series is a sequence of observations indexed by time, usually at regular intervals: hourly, daily, weekly, monthly. That ordering is not decoration. It is the whole point. In an ordinary supervised-learning table you may shuffle the rows freely, because each row is assumed independent and identically distributed. In a time series the rows are not independent: today's value is strongly related to yesterday's, and the very act of shuffling destroys the signal you are trying to model.
This single fact has deep consequences that we return to again and again:
- You cannot shuffle for cross-validation. Randomly splitting rows leaks future information into the past. Evaluation must respect the arrow of time, which is why this course dedicates an entire module to temporal cross-validation and backtesting.
- Autocorrelation is the signal. The correlation of a series with its own past (its lags) is often the strongest predictor you have. Where a fraud model looks for informative columns, a forecaster looks first at the series' own history.
- The data-generating process drifts. Trends grow, seasonal patterns shift, promotions and pandemics reshape demand, and regimes change. A model trained on last year may quietly go stale, which is why deployment and monitoring are part of the curriculum and not an afterthought.
A concrete illustration: suppose you model daily coffee sales at a chain of cafes with a standard regression, shuffling rows into train and test. Monday rows from June 2026 land in training while Friday rows from March 2026 land in test — the model has effectively seen the neighborhood of every test point. Offline error looks tiny. Deployed, the model faces a genuinely unseen future week and the error triples. Nothing was wrong with the algorithm; the evaluation was dishonest. Avoiding that dishonesty is a recurring theme of this course.
Pick up exactly where you left off
Pick the option that fits you; your account is created at checkout in under a minute:
What's next in this lesson
- The vocabulary you will use constantly
- A first look at real data
- Monthly totals of international airline passengers (a standard teaching series).
- The 2026 modeling landscape at a glance
- The strategy this course follows
- A mini case study in framing
- Where machine learning fits
- Common beginner mistakes
Everything you'll learn in this course
1 Foundations of Time Series Forecasting 4 lessons
- Why Time Series Forecasting Matters in 2026 Reading now 50 min
- The Anatomy of a Time Series: Trend, Seasonality, Noise 50 min
- Stationarity and Why It Matters 50 min
- Autocorrelation: ACF, PACF and the Language of Temporal Dependence 50 min
2 Exploratory Analysis and Preprocessing 2 lessons
- Exploratory Data Analysis for Time Series 50 min
- Preprocessing: Missing Values, Resampling and Transforms 50 min
3 Evaluating Forecasts Honestly 2 lessons
- Forecast Error Metrics: MAE, RMSE, MAPE, sMAPE, MASE 50 min
- Temporal Cross-Validation and Backtesting 50 min
4 Classical Baselines and Statistical Models 4 lessons
- Baselines and the Seasonal-Naive Benchmark 48 min
- ARIMA and SARIMA 52 min
- Exponential Smoothing: ETS and Holt-Winters 50 min
- Intermittent Demand: Croston, SBA and TSB 50 min
5 Feature Engineering for Time Series 2 lessons
- Lag, Rolling and Expanding-Window Features 50 min
- Calendar, Fourier and Exogenous Features 50 min
6 Machine Learning for Forecasting 5 lessons
- Reframing Forecasting as Supervised Learning 50 min
- Gradient Boosting with XGBoost and LightGBM 52 min
- Direct, Recursive and Multi-Step Forecasting 50 min
- Global Models and Cross-Learning Across Many Series 50 min
- Hyperparameter Tuning and Model Selection for Forecasting 50 min
7 Deep Learning for Time Series 2 lessons
- From MLP to LSTM for Sequences 52 min
- TCN, N-BEATS and N-HiTS 50 min
8 Transformers and Foundation Models 2 lessons
- Transformers for Forecasting: Informer and PatchTST 52 min
- Foundation Models: TimesFM, Chronos and Zero-Shot Forecasting 52 min
9 Probabilistic, Multivariate and Hierarchical Forecasting 3 lessons
- Probabilistic Forecasting and Prediction Intervals 50 min
- Conformal Prediction for Honest Intervals 50 min
- Multivariate and Hierarchical Forecasting 50 min
10 Tooling, Deployment and Applications 3 lessons
- The 2026 Forecasting Toolkit 48 min
- Deployment, Monitoring and Retraining 50 min
- Applications: Demand, Energy and Finance 50 min
11 Final Quiz — Time Series Forecasting with Machine Learning 1 lessons
- Final Assessment — Time Series Forecasting with Machine Learning 50 min
Everything you need to learn effectively
Interactive quizzes
Check your knowledge at the end of every lesson with scored quizzes and feedback.
Personal notes
Save notes on every lesson, accessible anytime from your dashboard.
Scheduled reviews
Revisit lessons exactly when it matters, at the right intervals — so you remember for the long term.
Progress & Achievements
Track your progress, unlock achievements, and visualize what you've learned.
Bookmarks
Save the lessons that matter and find them instantly when you need them.
Questions & Answers
Ask questions right on the lesson and get answers from our team.
Good to know before you start
How do I get access to the course?
You can read the beginning of the first lesson for free, right on this page. For the course you create an account, pick the subscription that fits — a single course or a bundle — and get access immediately after your payment is confirmed. Everything happens 100% online.
Can I cancel my subscription anytime?
Yes. Cancel anytime, straight from your account, in just a few clicks. Your access stays active until the end of the period you have already paid for.
What does the subscription for this course include?
All 30 lessons in the course, interactive quizzes, the AI Professor built into every lesson (select a passage and choose “Explain this to me”), within a fair-use limit, personal notes, automatically saved progress, and content updates included.
Is there a fixed learning schedule?
No. You learn at your own pace, on any device. Lessons are structured step by step, and the platform saves your progress automatically, so you can pick up right where you left off — anytime.
Ready to unlock all the content?
Just this course — €99 / month, VAT included — or every IT Pro course, with smart quizzes and the AI Professor included, in the bundle at €399 / month, VAT included.